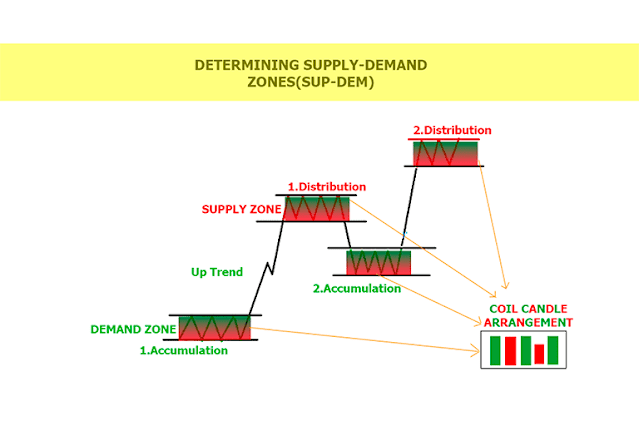
Sup-Dem(Supply and Demand) literally means supply and demand. When we say Sup-Dem zones, we mean supply-demand zones. Sup-Dem regions are places where the price moves horizontally for a certain period of time, accumulates, and intense bargaining is made between buyers and sellers. In the Sup-dem regions, the coil candle appearance, which is mentioned in the price action analysis, is seen. As in the image above, the red and green candles are aligned horizontally in a row.
The concept of sup-dem is one of the 3 main branches used in price action analysis. It is also called the connector zone. When we look at the price movements, it is seen that the price enters a decision stage before the upward movement or the downward movement in the exchange between the buyers and sellers who draw the chart on the board. At this stage, there is almost an arm wrestling between buyers and sellers. Meanwhile, horizontal movement and coil candle appearance occur in candlesticks. At the end of this process, if the price breaks the sup-dem zone to the upside with a bulky bullish candle, it will be a signal that the bullish move has begun. By the same logic, if price breaks the sup-dem zone to the downside with a bulky bearish candle, it will signal the start of a bearish move.
When we look at the cost of carrying the position, it would be ideal to enter the trade positions with the risk-return ratio, stoploss and takeprofit orders after the sub-dem zones are broken.
In short, on price charts, price moves from one sup-dem zone to another sup-dem zone. Here, sup-dem zones are kind of like bus stops.


0 Comments